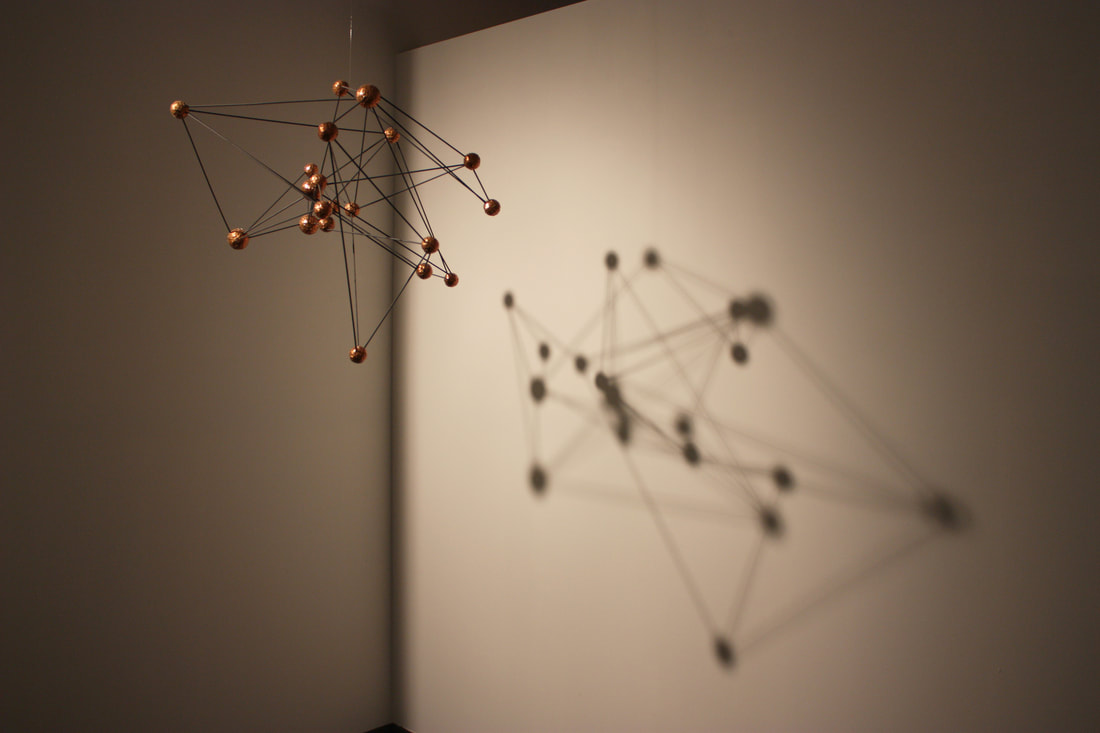
small worlds
2012. 3'x3'x3'. Mathematical graph of brain activity. Styrofoam, copper, wood.
One way in which scientific data can be represented is through what is called a “network”, a mathematical graph. With different types of data come different types of networks, varying in overall architecture and connective properties. The “Small World Network”, developed by Strogatz & Watts in 1998, has an architecture which reflects the connective behavior of different brain areas during consciousness. Other systems which show small world properties include road maps, metabolic processing, voter networks, and social networks, among others.
One way in which scientific data can be represented is through what is called a “network”, a mathematical graph. With different types of data come different types of networks, varying in overall architecture and connective properties. The “Small World Network”, developed by Strogatz & Watts in 1998, has an architecture which reflects the connective behavior of different brain areas during consciousness. Other systems which show small world properties include road maps, metabolic processing, voter networks, and social networks, among others.


All images © Julia Buntaine Hoel
